Designing map architecture
We propose to design a map starting with a single diagram in SBGN Process Description (PD) or SBGN Activity Flow (AF) and gradually creating a more advanced architecture. This way each version of the map is a fully functional resource ready for exploration and applications. The multi-layered structure with multiple maps in PD and AF layers aims to solve the complexity management problem when the network becomes increasingly more extensive and hard to manage.
Recommended design options
More than one approach is possible. Depending on a project it is recommended to start from a single PD diagram and step by step build a multi-layered structure. In case of extensive coverage of biological functions or limited resources it might be more efficient to start from an AF diagram and a top-level view. The option to choose depends on the research topic, linked projects or the umbrella project, resources dedicated, availability of similar disease maps and their structure, availability of needed information in pathway databases and in the literature.
 Figure 1. A recommended way of gradually developing a multi-layered structure starting from one PD diagram and a top-level view. This option is suggested as the first choice. Estimated resources required: depending on the topic - one experienced curator for two years with the support of domain experts.
 Figure 2. A variation with the focus on maintaining PD and AF layers first.
 Figure 3. A variation with the focus on the PD layer with multiple diagrams.
 Figure 4. A variation with the focus on the AF layer with multiple diagrams. This option is advised in case of extensive coverage of biological functions or limited time/resources available. Estimated resources required for building up to version C: one curator for 6-12 months with the support of domain experts.
 Figure 5. A variation that starts with building a top-level view first. This option looks intuitive for planning the content first and then adding more details but it is more demanding in terms of experience in building disease maps.
Examples
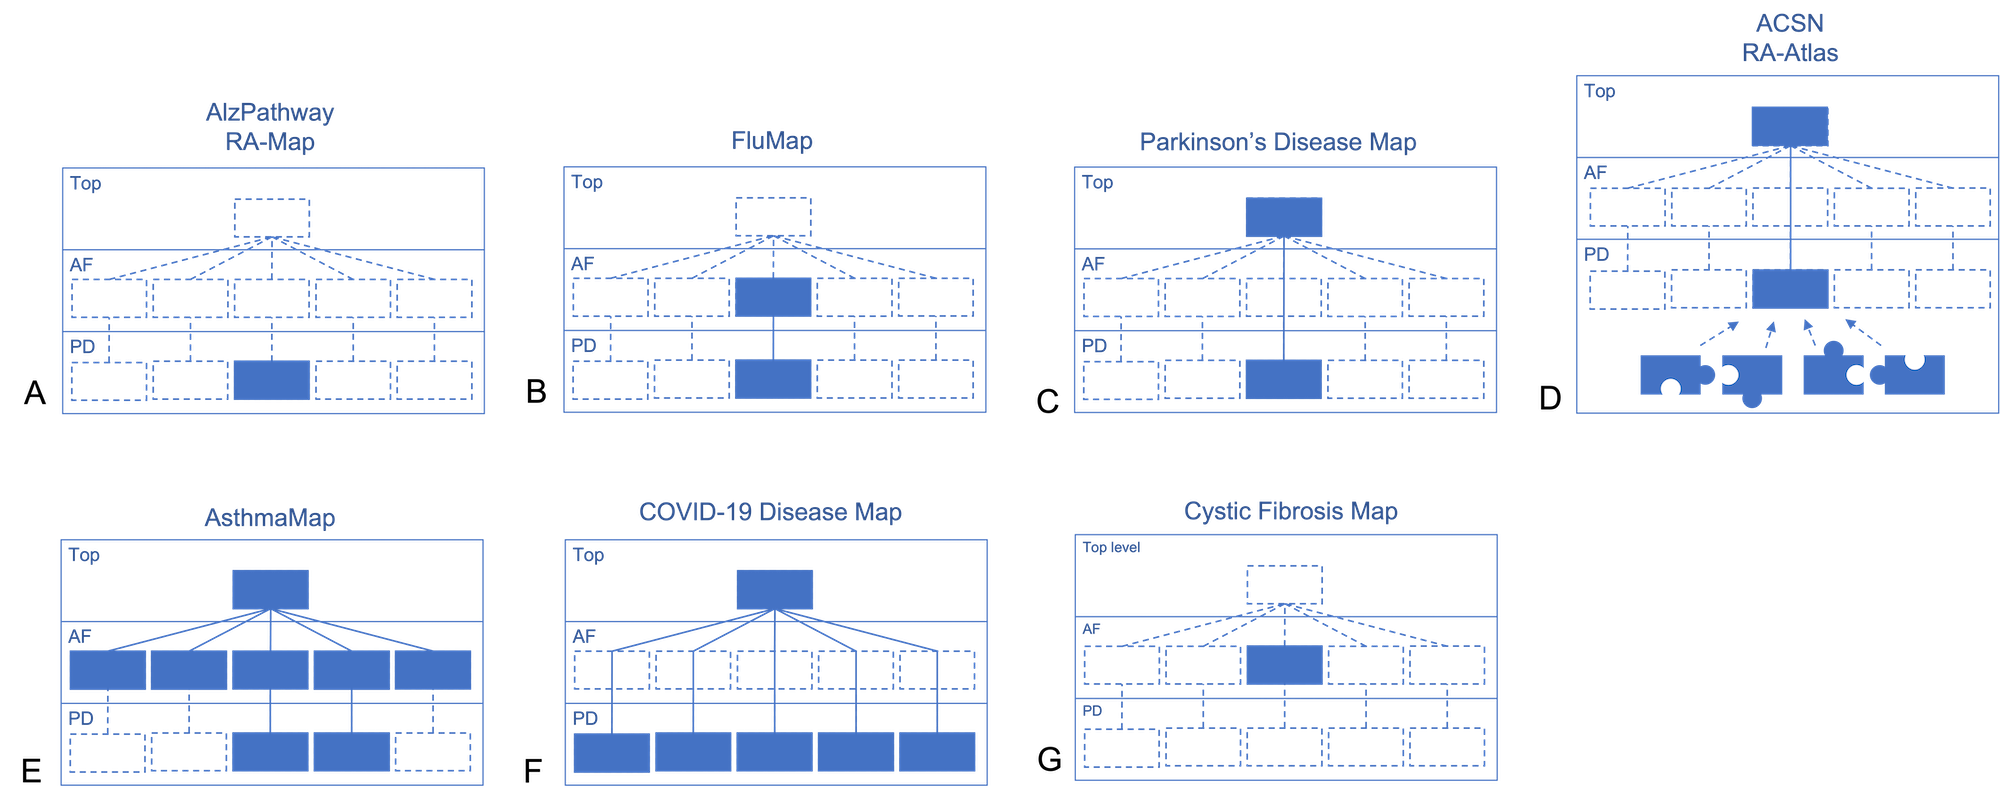
The architecture of the published disease maps varies from a single map in PD or AF to multi-layered hierarchically-organised structures with multiple separate diagrams in a layer.
 Figure 6. Examples of map architecture of the published resources. A. A single PD diagram (PMID:22647208, PMID:32311035, PMID:30520978). B. One PD diagram with a matching AF represetation (PMID:24088197). C. One PD diagram with a top-level view (PMID:23832570). D. An extensive PD network with parts designed and maintained as separate diagrams, with a top-level view (PMID:26192618, doi:0.3389/fsysb.2022.925791).
E. PD, AF and top-level view layers, with AF as split diagrams that are partly covered in the corresponding PD diagrams. The top-level view works as a “unifying” diagram to create a single virtual network (PMID:33309742). F. Split PD diagrams with a top-level view to unify them into a single virtual network (PMID:34664389). G. A single AF diagram (PMID:34782688).